
FairWatch: Real-Time AI Fairness Monitoring Dashboard for Healthcare
A platform for continuous monitoring of healthcare AI systems, detecting model drift, latency spikes, data quality degradation, and fairness disparities to support safer and more equitable model operations.
FairWatch
A real-time monitoring platform for healthcare AI systems that tracks model health, fairness disparities, and alert workflows in one operational dashboard.
Overview
Project type: Responsible AI monitoring / healthcare AI operations
Role: Product architecture, fairness monitoring design, backend API implementation, dashboard delivery, alert workflow design
Core value: Brings fairness, drift, latency, and incident management into a single operational view for healthcare AI teams
Stack: React 19, FastAPI, SQLAlchemy 2.0, Recharts, JWT auth, PostgreSQL, Docker
At a glance
- Tracks accuracy, drift, latency, missing data, and prediction volume
- Disaggregates model performance by age group, gender, and insurance type
- Generates severity-based alerts for operational and fairness issues
- Supports triage workflows with active, acknowledged, and resolved states
- Designed for healthcare teams that need auditability, explainability, and operational accountability
- Built to treat fairness as a live operational signal, not a delayed compliance report
The Problem
Healthcare organizations are increasingly deploying AI systems for readmission prediction, imaging support, and clinical risk scoring.
The issue is not only whether these models are accurate. The issue is whether they remain reliable and equitable after deployment.
Common failure modes include:
- Silent degradation: a model can drift significantly after release as patient populations, care pathways, or input distributions change
- Hidden bias: aggregate accuracy can look healthy while disadvantaged groups experience much worse outcomes
- No incident trail: teams may notice issues informally, but without a structured workflow there is no auditable record of response
- Fragmented tooling: fairness, latency, drift, and operational incidents are often tracked in separate systems with no unified view
For healthcare AI, fairness cannot be treated as a quarterly review artifact. It needs to be monitored alongside uptime and performance.
The Approach
FairWatch is a real-time AI monitoring platform built around one core principle:
A model that performs well on average but harms a subgroup is not a healthy model.
The workflow follows four stages:
- Monitor: ingest model health metrics such as accuracy, drift score, latency, missing rate, and prediction volume
- Disaggregate: break performance down by demographic segment to reveal subgroup disparities
- Alert: generate severity-based alerts when operational or fairness thresholds are crossed
- Triage: move alerts through a structured lifecycle with timestamps, attribution, and investigation notes
Why this design
The platform was shaped by three practical requirements:
- Fairness must be operational: it should appear in the same dashboard as drift and latency
- Incidents must be auditable: teams need a traceable response history, not informal chat threads
- Segment visibility matters: fairness is only actionable when teams can see which groups are affected
Architecture
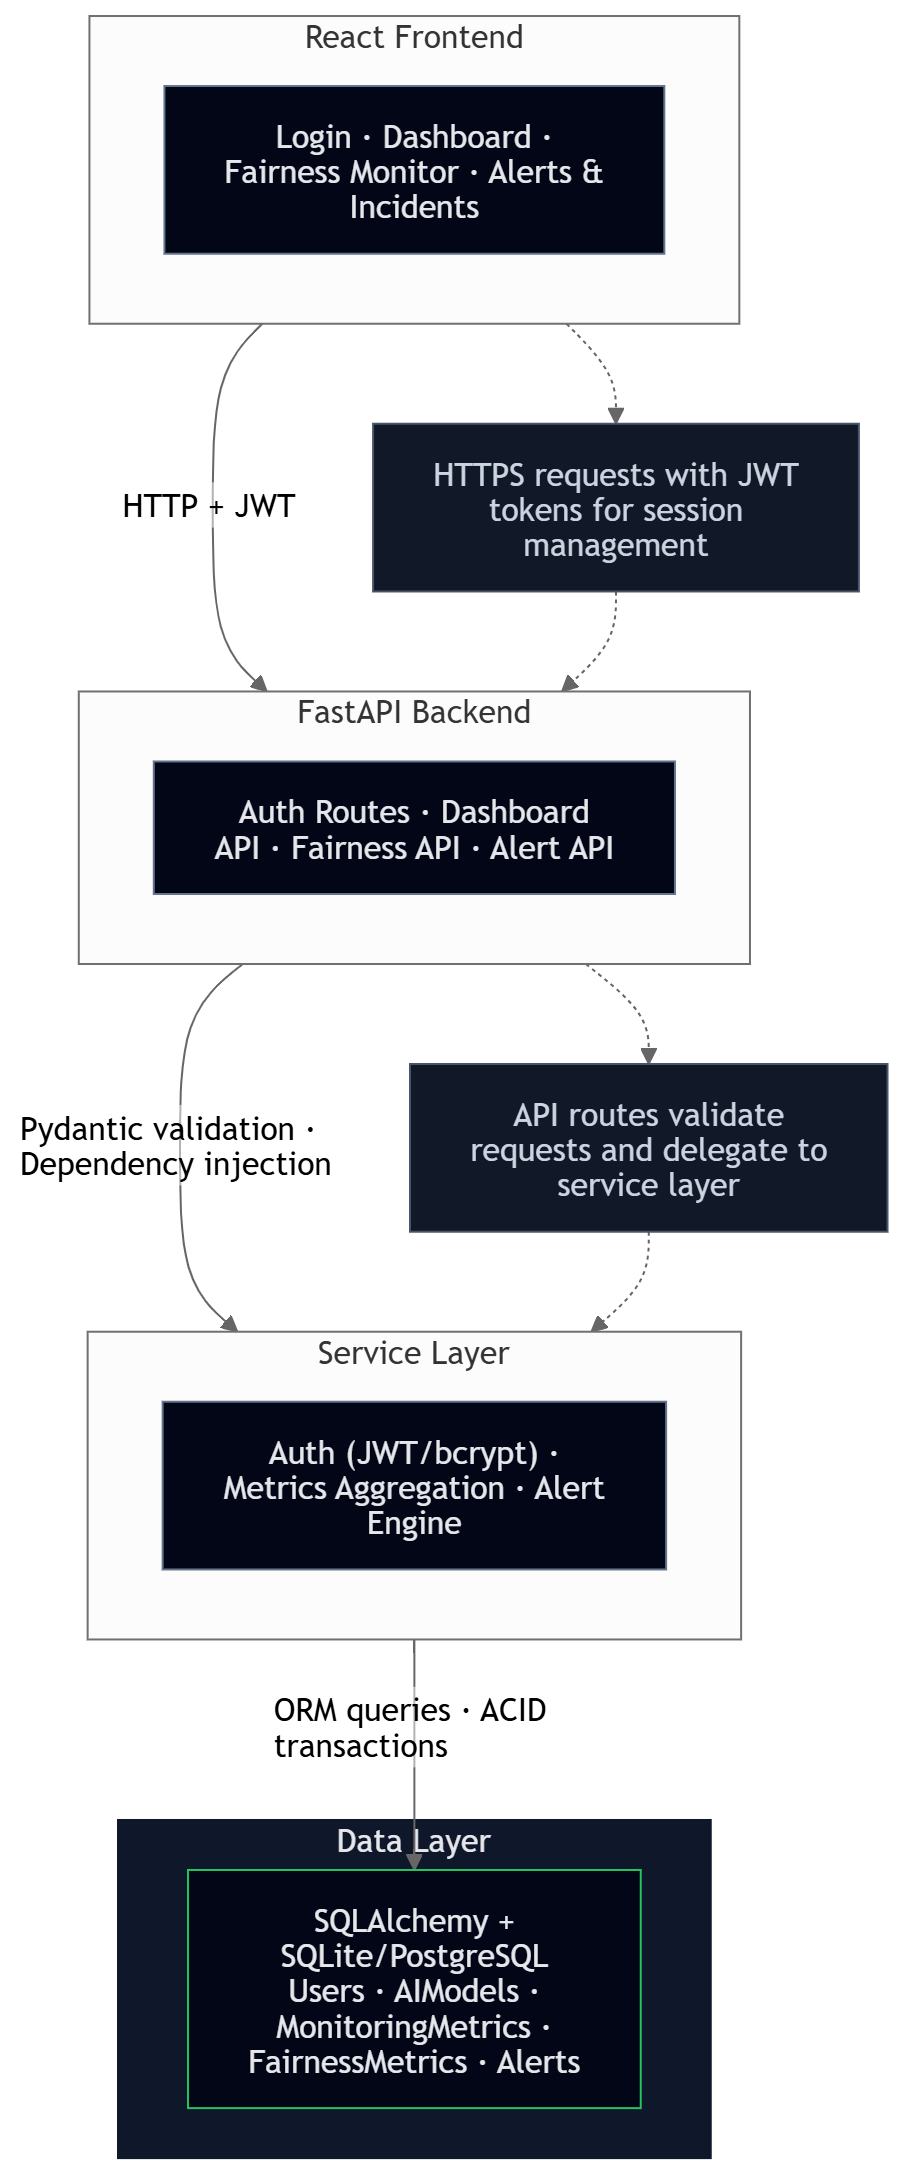
Architecture highlights
- Unified model health and fairness monitoring in one application surface
- Alert engine connected to threshold breaches across both technical and demographic metrics
- Structured incident workflow for acknowledgment, resolution, and auditability
- Clear separation between monitoring metrics, fairness metrics, alerts, and role-based access
Key Technical Decisions
1. Fairness as an operational metric, not a separate audit
Many organizations evaluate fairness only during model review cycles or periodic audits.
FairWatch instead tracks fairness at the same operational cadence as latency and drift. In the seed scenario, fairness metrics are updated every 6 hours. This makes demographic disparities visible while they are still actionable, rather than after months of unnoticed impact.
2. Segment-level disaggregation over a single fairness score
A single fairness score can hide who is actually being affected.
The platform stores metrics by segment value, such as insurance_type: uninsured or age_group: 65+, allowing teams to see exactly where the disparity sits. This makes the system more useful for investigation and remediation than a single composite fairness number.
3. Threshold-based alerts with severity levels
Not every issue deserves the same operational response.
FairWatch uses a four-level severity model-low, medium, high, critical, so teams can distinguish between minor metric drift and a serious fairness or patient safety concern. This makes the monitoring output more aligned with real operational workflows.
4. Alert lifecycle with audit trail
A monitoring platform is only useful if teams can act on what they see.
Alerts move through active, acknowledged, and resolved states. Each transition is timestamped, attributed to a user, and can include notes. This creates a compliance-friendly incident history and reduces reliance on memory or scattered communications.
5. JWT for stateless authentication
JWT was selected to support stateless authentication and future multi-client monitoring workflows.
This choice supports horizontal scaling and potential future API consumers, such as automated monitoring scripts or additional internal clients. The trade-off is token revocation complexity, which is acceptable for the current internal platform scope.
6. SQLite for local development, PostgreSQL for production
The platform uses SQLite for low-friction development and PostgreSQL for production-grade concurrency.
Because SQLAlchemy abstracts the database layer well, the switch is environment-driven rather than code-driven. That keeps local setup simple while preserving a clear upgrade path.
7. Recharts for dashboard-native visualization
Recharts was selected because it provides a strong balance of speed, clarity, and React-native integration.
D3 would offer more flexibility but at significantly higher implementation cost for common monitoring views. Dashboard frameworks would reduce UI control. Recharts allows custom fairness and monitoring views without unnecessary complexity.
Features
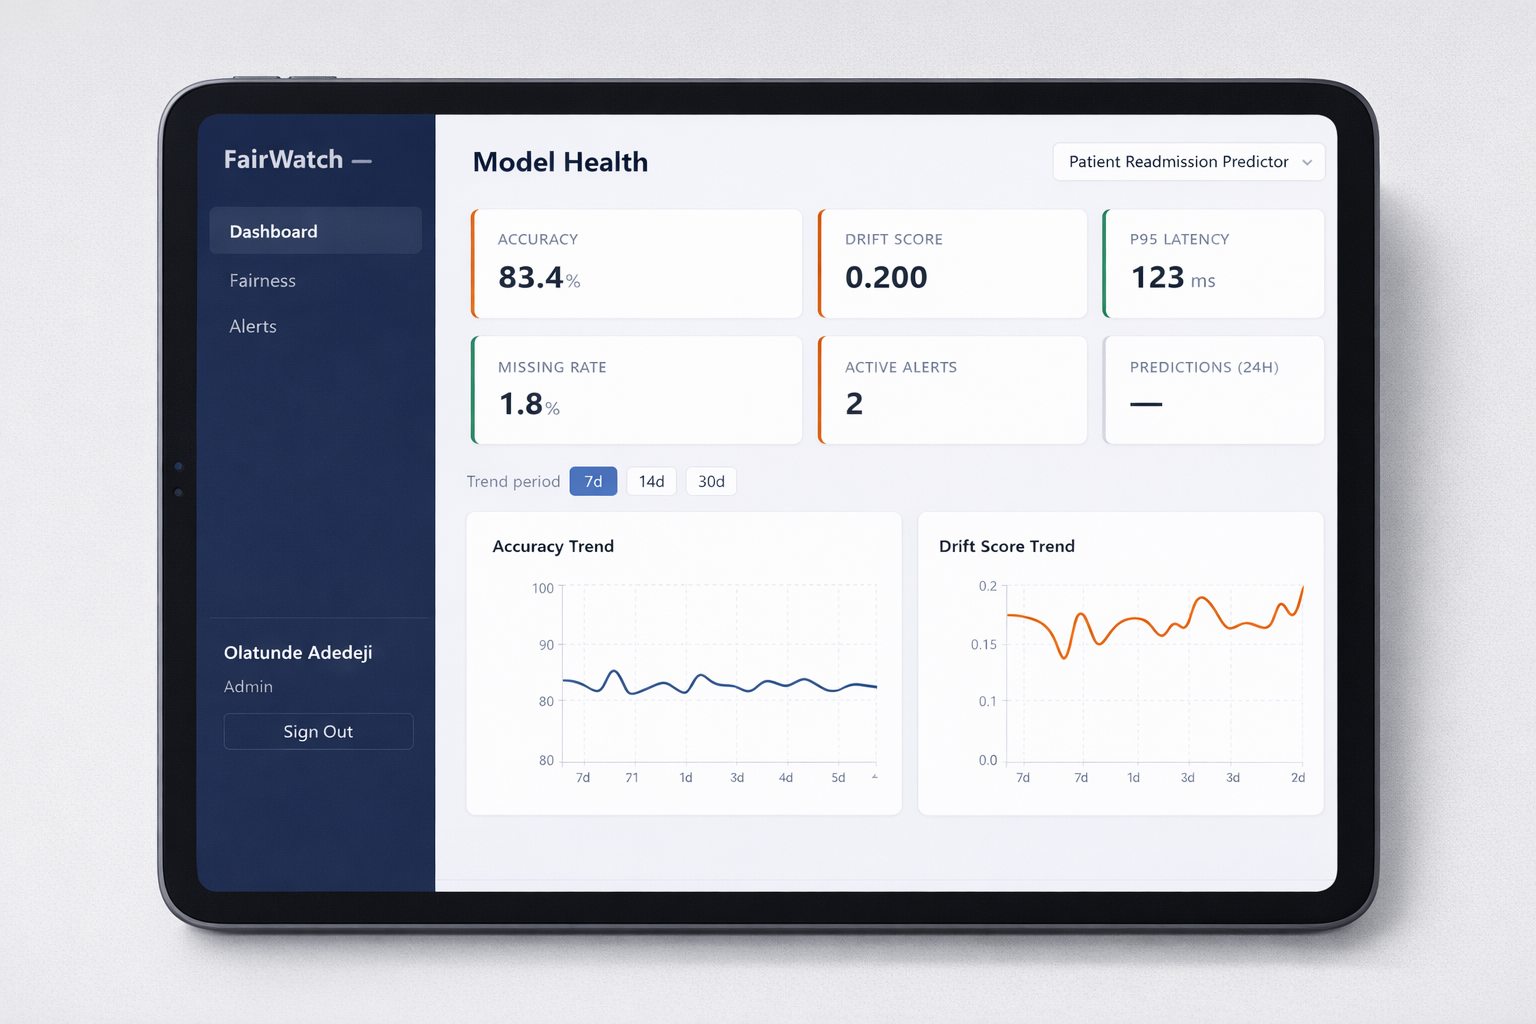
Model Health Dashboard
The primary dashboard tracks model-wide health signals:
| Metric | What It Tracks | Alert Threshold |
|---|---|---|
| Accuracy | Prediction correctness over time | < 80% |
| Drift Score | Distribution shift from training data | > 0.15 |
| P95 Latency | 95th percentile response time | > 500ms |
| Missing Rate | Data quality and incomplete input fields | > 3% |
| Active Alerts | Unresolved incidents for the model | > 0 |
| 24h Predictions | Model throughput volume | Context-dependent |
Trend charts support 7, 14, and 30-day monitoring windows.
Fairness Monitor
The fairness dashboard breaks performance down by demographic segment:
| Segment Type | Values | Why It Matters |
|---|---|---|
| Age Group | 18–30, 31–50, 51–65, 65+ | Older patients may have different clinical risk patterns |
| Gender | Male, Female, Non-binary | Historical data imbalance can affect model quality |
| Insurance Type | Private, Medicare, Medicaid, Uninsured | Socioeconomic proxy linked to downstream care outcomes |
The fairness view includes:
- Accuracy gap indicator to show the spread between best- and worst-performing segments
- Segment comparison chart for side-by-side subgroup performance review
- Error breakdowns including false positive and false negative rates per segment
- 30-day trend lines to show whether disparities are widening or narrowing
- Detailed breakdown table for accuracy, error rate, FPR, FNR, and prediction count
Alert & Incident Management
Alerts move through a structured lifecycle:
[Threshold Breach] → Active → Acknowledged → Resolved
Open http://localhost:5173 and sign in with analyst@ola.ai / analyst123.